Garry Kapoor
Senior UX Leader, Connected Buildings
The Connected Buildings portfolio view answers one question across all of them: where is value being identified, lost, realized, and projected — across Energy, Asset Lifecycle, and Operations? The morning that used to be spent assembling that picture now opens on a single screen.
"I'm responsible for dozens of buildings, and every one of them reports differently. I don't want to learn a separate dashboard for each site — I want one consistent picture across the whole portfolio, so I can see where value is being created and where it's leaking without translating between tools." A portfolio manager isn't fixing faults at a panel. They're accountable for the performance of the entire estate — and answering for it to the people above them.
The KPI model — identified, lost, realized, and projected savings across Energy, Asset Lifecycle, and Operations — had already been validated at the single-site level on the ROI Dashboard. The research carried straight over. The question here was different: what happens to that picture when one person owns thirty of those sites at once? The model stayed; the scale changed everything about how it had to be read.
Each building presented value its own way. Switching between them cost time and quietly eroded trust in the numbers.
Energy, Asset Lifecycle, and Operations lived in separate places — assembling the morning picture was a manual chore, repeated daily.
An operator moving between sites had to re-learn the conventions each time, slowing the work and the confidence behind it.
I carried the proven ROI KPI model up to the portfolio level and harmonized the displays and workflows so every building reads the same way. Identified, lost, projected, and realized value — across Energy, Asset Lifecycle, and Operations — resolved into one estate-wide view, with a consistent path from the portfolio down to any single site without ever changing how you read it.

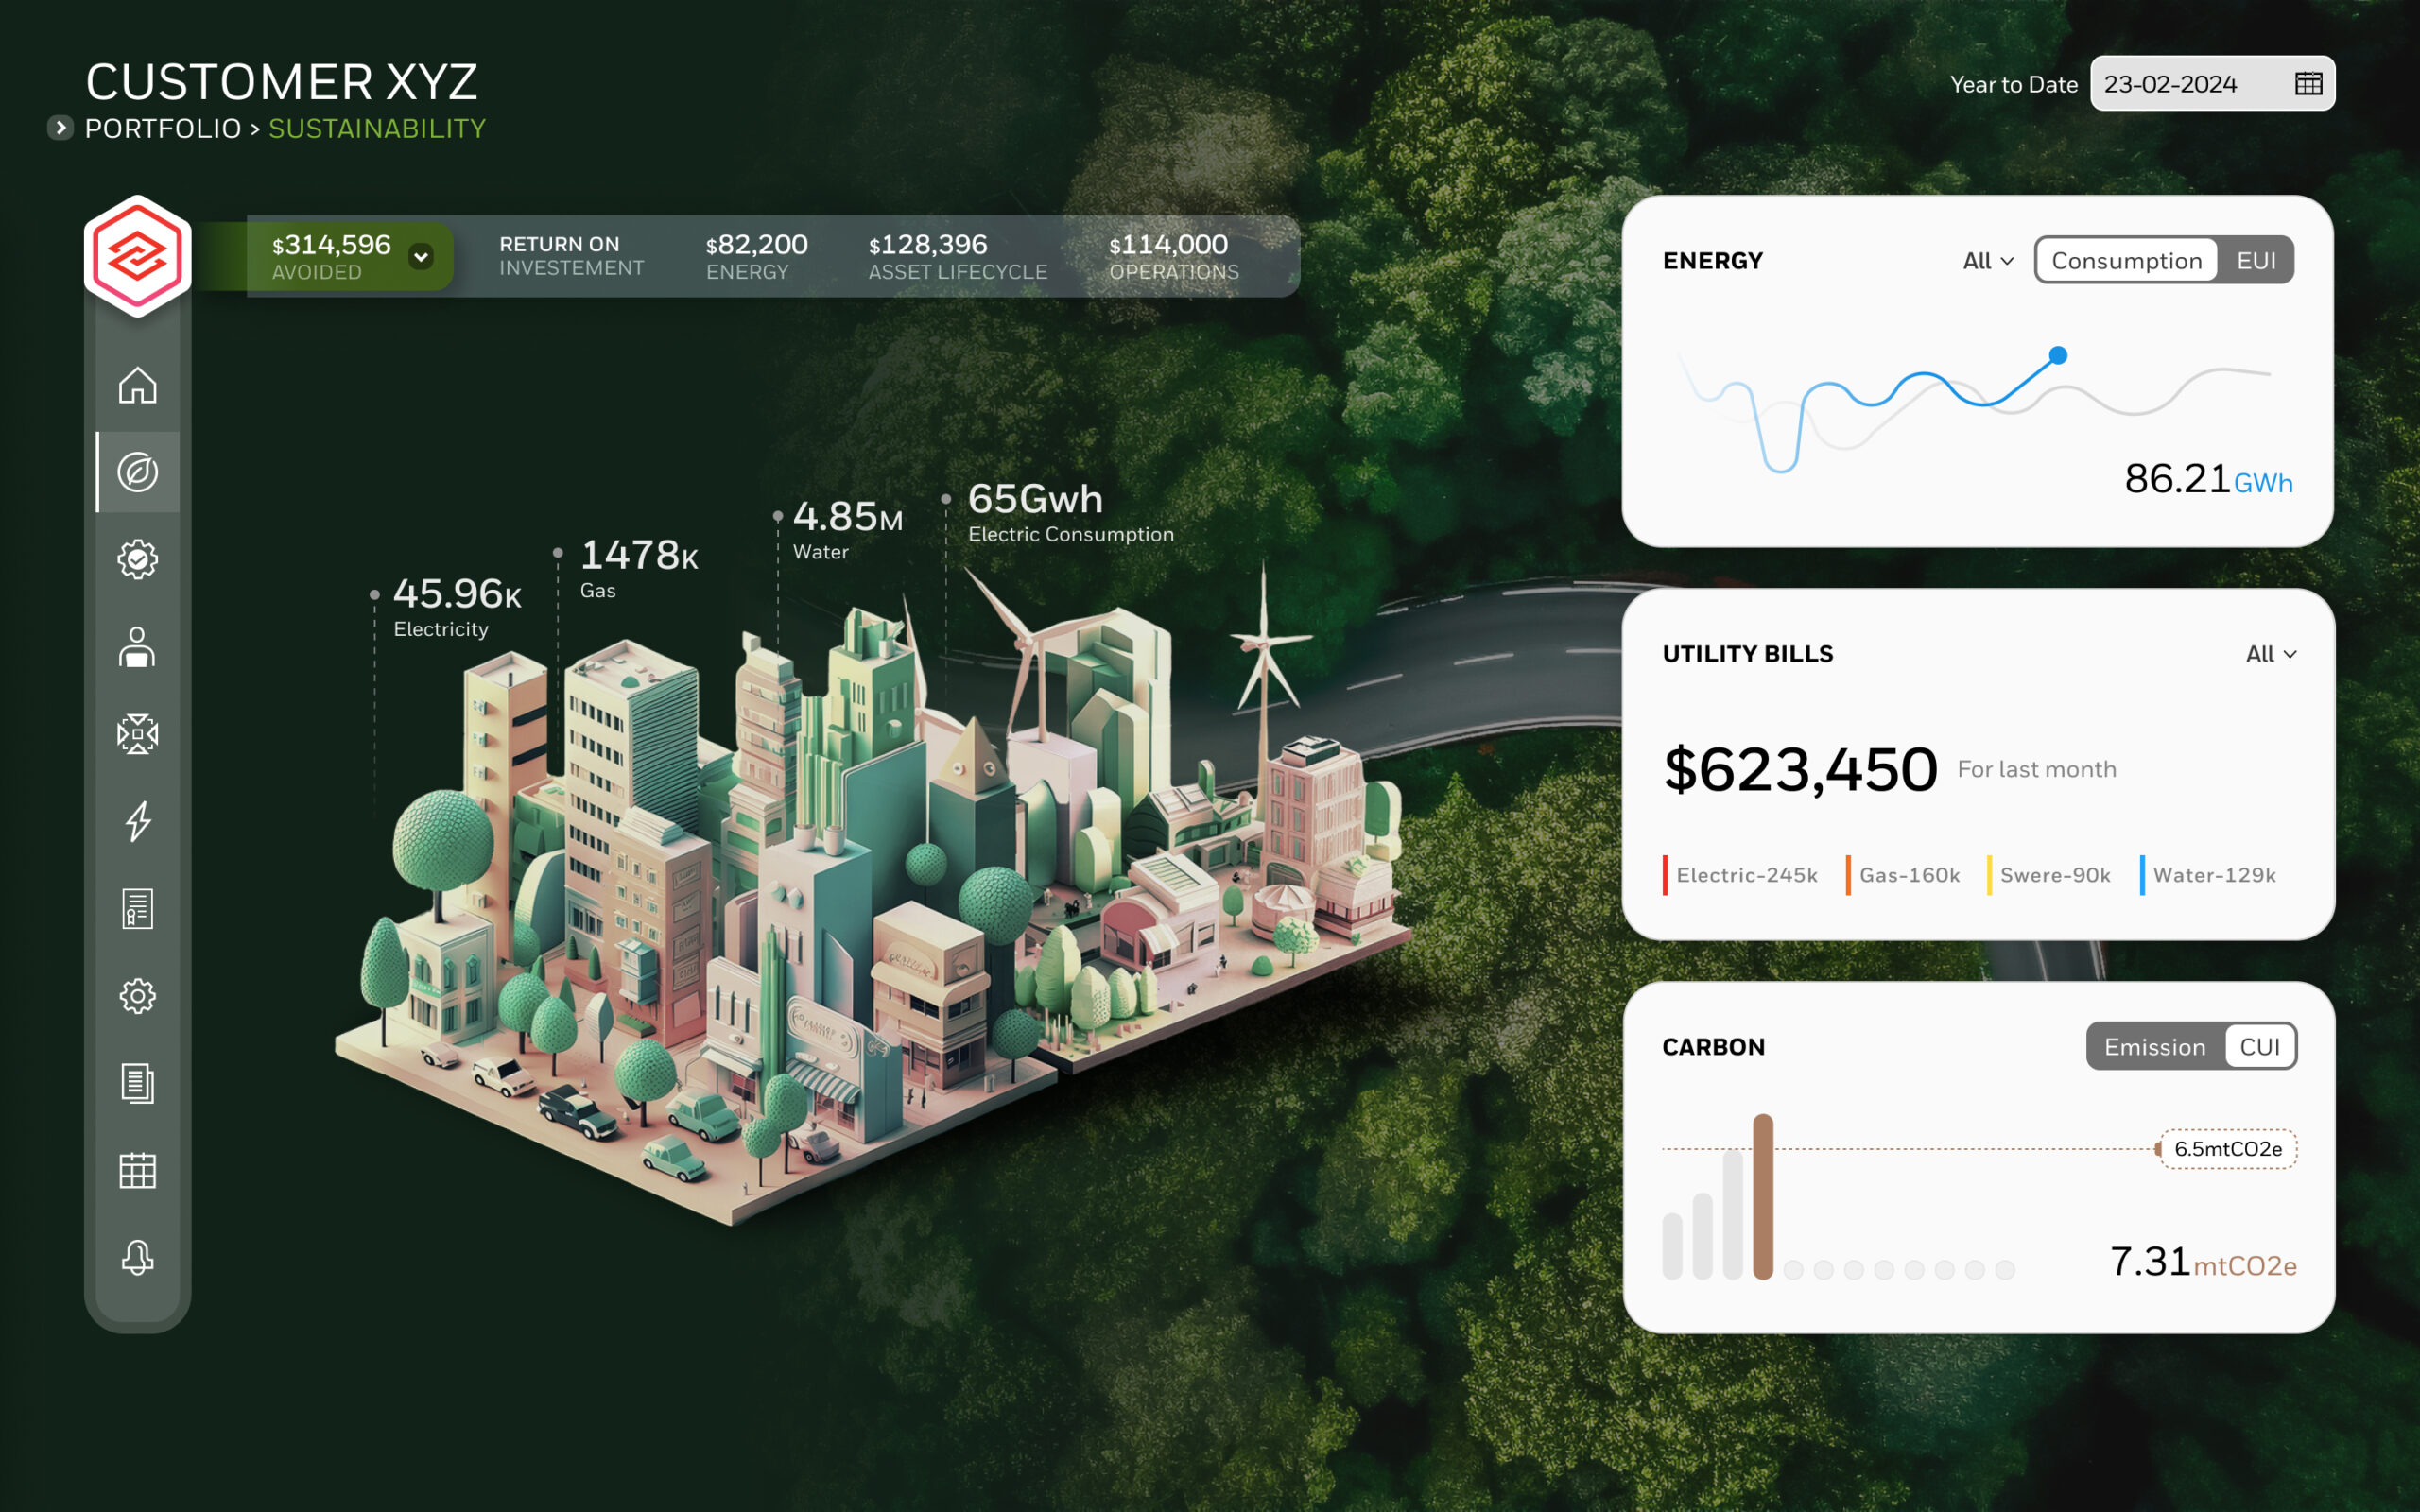
Every site in one language — value across the whole estate on a single screen.
Energy and carbon performance, consistent across every building in the portfolio.
With the displays harmonized, the portfolio manager stopped re-learning a dashboard for every site and started reading the whole estate in one consistent language. The morning that used to be spent pulling Energy, Asset, and Operations data from separate tools and stitching it together now opens on a single screen — and an operator who moves between buildings carries the same mental model with them instead of rebuilding it each time.
A customer with thirty sites cannot read thirty dashboards. Now they read one.